Ultimate 2023 Guide: Choosing the Right JavaScript Library for Data Visualization

Data is an integral part of any application, and understanding how to visualize it can empower both the end-users and the application developers. This article discusses some of the best JavaScript data visualization libraries for 2023 and provides a detailed guide on how to choose the right one for your project.

Overview of Different JavaScript Data Visualization Libraries

Before we delve into how to choose the best library for your projects, let’s take a look at some of the top options:

  • D3.js
  • Recharts
  • Victory
  • React-vis
  • V Charts
  • Trading Vue.js
  • Chartkick
  • Flexmonster
  • Webdatarocks
  • ApexCharts
  • Chart.js
  • Echarts
  • Frappe Charts
  • Nivo
  • Google Charts
  • amCharts
  • CanvasJS
  • Highcharts
  • Zoomcharts

How to Choose the Right JavaScript Data Visualization Library

When choosing a data visualization library, you should consider the following factors:

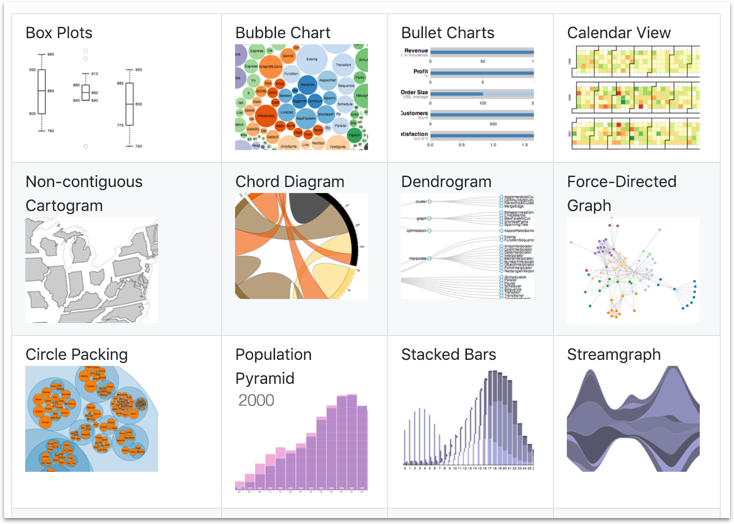
  1. What kind of charts do you want to build? Some libraries support only a handful of types. You should know which ones you need before you select a library.

  2. How large is your dataset? Libraries based on SVG are usually better for smaller to medium datasets, while Canvas-based tools are more suited for large datasets.

  3. What platform is the app being used on? Some libraries are better at responsiveness; a few others have their own React Native versions, like Victory.

  4. What’s the browser support for a given library? You should check your browser market share before choosing your library.

  5. What JavaScript framework do you use? Your chosen data viz library should be compatible with it. For example, if you’re using React, a React-specific library might be a better option.

  6. What kind of customization do you need? If you need advanced animations, for example, you should take that into consideration.

Sometimes, you might not need a JavaScript data visualization library at all. You might be better off spending resources on the developing part rather than trying to manipulate libraries to fit your particular needs.

Top JavaScript Data Visualization Libraries

Here’s more detail on a few of the libraries we’ve mentioned:

D3.js

D3.js
Everything you can think of can be done with this library, but it has a steep learning curve, and the documentation is outdated. [Examples Here](D3 GitHub)

And many others…

Conclusion

The right choice of a data visualization library depends on your project’s specific requirements. Be sure to factor in the type of charts needed, the size of your dataset, the platform your app is used on, browser support, the JavaScript framework you’re using, and the level of customization required. With careful thought and planning, you can find the perfect data visualization library that suits all your needs.

Tags: #JavaScript, #DataVisualization, #JSlibraries, #VisualizationLibraries

Reference Link

Top React Chart Libraries for Data Visualization in Your Applications

Data has become an essential part of most sectors. However, plain raw data can be harder to read and interpret. Therefore, we transform these raw figures into attractive and understandable visuals through data visualization. This visualization can help decision-makers to effortlessly understand complex data, enhance user engagement, and offer greater accessibility to the information. In the realm of JavaScript, React happens to be one of the most popular UI libraries for building such visual interfaces.

Understanding React and React Chart Libraries

React, utilized by major corporations such as Meta (previously Facebook), Uber, and Airbnb, allows developers to create powerful applications. Although developing charts using only React is feasible, using a chart library can hasten the development process and provide additional features.

A React Chart Library is a collection of components that developers can utilize to create charts, thus allowing for faster development, reusability of components across the application, and code customization. Below, we’ll list some of the best React chart libraries available.

Top React Chart Libraries

From different types of charts to customizable components, these libraries offer a set of features to cater to your specific needs.

React Charts

React Charts is SVG-based and offers various chart types like Bar, Line, Area, Bubble, etc.

  • Declarative
  • Different chart types
  • Hyperresponsive
  • SVG-based
  • Customizable

Recharts

Recharts is a composable chart library built on top of React and D3 that allows you to combine different components as per your needs.

  • Composable
  • Customizable
  • Responsive
  • Declarative

React-vis

A library that provides a set of base visualization components, giving developers the control over all the aspects of visualization.

  • React-friendly
  • Simple
  • Flexible
  • Customizable

Apache Echarts

  • Many types of charts
  • Custom Series
  • Optimized for different screens
  • Multiple data formats
  • Multirendering solutions
  • Dynamic data

React-chartjs-2

  • Different components
  • Customizable
  • Optimized

BizCharts

  • Strong expansion capabilities
  • Based on React ES6 grammar
  • Variety of data visualization charts
  • Easy to use

Rumble Charts

  • Various components
  • Composable
  • Customizable
  • Optimized

Ant Design Charts

  • Wide variety of charts
  • Data binding
  • Customization
  • Data exporting

Nivo

  • Different chart types
  • Highly customizable
  • Responsive charts
  • Patterns

Visx

  • Unopinionated
  • Built on TypeScript
  • TypeScript
  • Flexible

Syncfusion React Charts

  • Data editing
  • SVG rendering
  • Exporting
  • Globalization
  • Trendlines

Conclusion

The React chart libraries provide a comprehensive and efficient way to visualize data in your applications. But remember, the library you choose to integrate into your applications should depend on its features and ease of use. Therefore, understand your requirements before diving into one of them!

Tags: #DataVisualization #React #ChartLibraries #WebDevelopment

[Reference Link](https://geekflare.com/react-chart-libraries/)

Top React Native Chart Libraries for Enhanced Data Visualization in Mobile Apps

Data visualization plays a crucial role in understanding complex datasets, making it easier for users to comprehend and utilize data effectively. By using graphs, charts, diagrams, and interactive infographics, we can present data simply and understandably. One such technology offering excellent data visualization is React Native, a popular framework for creating superior user interfaces.

This blog post explores a selection of the most effective React Native chart libraries, complete with examples and benefits, that you can utilize in your mobile development projects.

Importance of Charts in Mobile Applications

In mobile apps, data visualization is not only a choice but a necessity. Converting data into an easy-to-understand format gives users a better engagement experience, transforming raw, and unorganized data into valuable insights.

Through this article, we’ll journey through the top React Native chart libraries to help you enhance user experiences in your app, making data more understandable and actionable.

Best React Native Chart Libraries for Mobile App Development

React Native Chart Kit

React Native Chart Kit

The React Native Chart Kit is an excellent library for creating engaging charts. It offers a variety of chart types, including bar, pie, progress, bezier line, and line charts. It is responsive, easy to integrate, and comes with variable color schemes.

GitHub Repository

Benefits of Using React Native Chart Kit

  • Instant development environment
  • Dynamic tappable toolkits
  • Simplified productivity tool
  • Exceptional visualization of charts

React Native SVG Charts

React Native SVG Charts

This library utilizes React-native-SVG for rendering its graphs. It supports most chart forms, including Line, Pie, YAxis, XAxis, StackedBarChart, StackedAreaChart, Area, and progress circle charts.

GitHub Repository

Benefits of Using React Native SVG Charts

  • Straightforward visualization project
  • Professional approach with maximum convenience
  • Native SVG support

React Native Charts Wrapper

For Android:
React Charts Wrapper for Android

For iOS:
Native Charts Wrapper for iOS

This open-source library supports both iOS and Android platforms. It offers a variety of supported chart types, like line, scatter, bubble, pie, and more.

GitHub Repository

Benefits of Using React Native Charts Wrapper

  • Suitable for beginners
  • Uses HTML5 Canvas elements
  • Easy to understand and implement
  • Provides JavaScript-specific library creation

Victory Native

Victory Chart

Victory Native is very well known for its composable and declarative API, making the creation of interactive data visualizations a breeze.

GitHub Repository
Documentation

Benefits of Using Victory Native

  • Easy and straightforward chart integration
  • Identical APIs for Android and iOS data generation
  • Simplified cross-platform charting

Other Noteworthy Libraries

  • React Native Pie Chart
  • React Native Responsive Line Chart
  • React Native E-charts Wrapper

Conclusion

All the libraries mentioned in this blog post are great tools for data visualization in React Native. Depending on your app’s needs and requirements, you can choose and experiment with the one that suits your project best. By embracing these frameworks, you can create clear, attractive, and helpful graphical representations of your data, enhancing the user experience of your mobile apps.

Frequently Asked Questions

  1. What is the best chart library for react native?
  2. What are the libraries for charts in React?
  3. How do you implement a chart in react native?
  4. Can I use GraphQL with React Native?
  5. Should I use Axios or React Native?

Tags: #ReactNative #DataVisualization #MobileAppDevelopment #ChartLibraries

[Reference Link](https://webmobtech.com/blog/react-native-chart-libraries/)

Top React Charting Libraries for Data Visualization in 2023: A Comprehensive Guide

Choosing the right charting library for your React project is an underrated aspect of your decision-making process. It can be significantly impacting your project, especially when your product involves a lot of data visualization. This is a substantial kind of commitment that you want to make sure you get it right at the onset. To help streamline this process, we’ve curated some of the best React Charting Libraries for 2023.

Consider this your comprehensive guide!

React Charting Libraries To Explore

Here are some key libraries you should consider:

  1. react-chartjs-2
  2. nivo
  3. Recharts
  4. Victory
  5. visx
  6. React Charts
  7. react-vis (Bonus)
  8. React Stockcharts (Bonus)

1. React-Chartjs-2

React-Chartjs-2 is a React wrapper for Chart.js, a simple yet flexible JavaScript charting library. It boasts an active open-source community, is compatible with all modern browsers and Internet Explorer 11, and supports a variety of customizable chart types.

alt text

Key Features:

  • Active open-source community
  • All modern browsers and IE11+ compatible
  • Responsive
  • 9 customizable chart types

Conclusion:

React-Chartjs-2 provides an extensive list of usable examples, making it a solid choice for your React project.

2. Nivo

Nivo, a built by Raphaël Benitte and Neil Kistner and supported by an active community, provides a large list of charting and data visualization components.

alt text

Key Features:

  • Highly customizable.
  • Includes react-spring for animations.
  • Provides an interactive components playground.
  • Exhaustive Documentation.

Conclusion:

This library is well-equipped with graphically great components. If you’re aiming for something visually pleasing and functional, nivo could be your choice.

3. Recharts

Recharts is an excellent choice for those aiming to create intuitive and composable charts. It’s lightweight and built on top of SVG elements, providing additional customization opportunities.

alt text

Key Features:

  • Composable.
  • Built on top of SVG elements.
  • Lightweight dependency on D3.
  • Customizable

Conclusion:

Recharts is a flexible and widely-used library suitable for most data visualisation needs.

Wrapping Up

Nailing down the right charting library for your React project could be daunting. It’s essential to consider not just your immediate visualization needs but also your project’s scalability.

There are several react charting libraries out there, so we have done the research and created a curated list for you. We believe that this will help you save time by focusing more on coding, prototyping, and deciding which among these libraries best fit your project.

Happy coding!

tags: #react, #charting, #datavisualization, #libraries
Reference Link